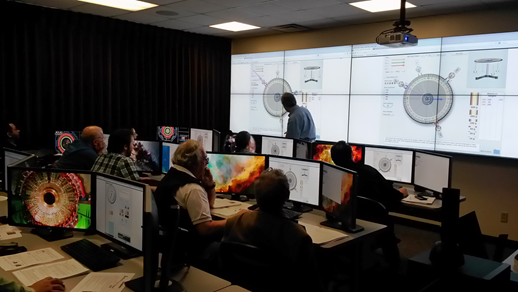
At Bellarmine University, we have set up a state-of-the-art Advanced Visualization and
Computational Lab using the next generation video-wall
technology, called Hiperwall (Highly Interactive Parallelized Display
Wall), to enable visualization of very large datasets from the ATLAS
experiment. The novel Hiperwall technology was developed by
University of California at Irvine (UCI) at the
California Institute for Telecommunications and Information Technology
(Calit2). It was designed
to be a collaborative visualization platform capable of displaying
information in real time.
Hiperwall is a high
performance and a high resolution visualization system and was originally
developed for large scale visualization needs. Hiperwall’s
middleware allows researchers in geographically diverse locations to
collaborate on Big Science experiments that generate Big Data. This is the first display wall that has been
set up in the US in high energy physics with the Hiperwall technology
for large scale visualization of data events. So, we broke new grounds by being the first
undergraduate institution in the US (and the only institution in
Kentucky) to implement the Hiperwall technology
in the field of high energy physics for data analysis and visualization
of the large-scale data events. We also developed a local automated web-based Hiperwall
visualization web interface within the Hiperwall environment for our
data-event visualization display needs.
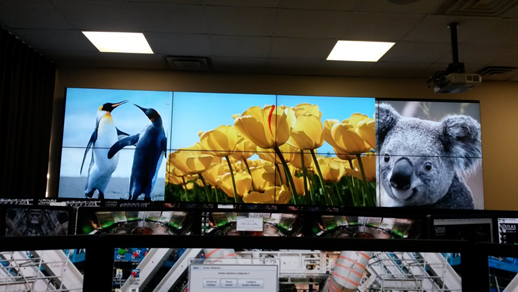
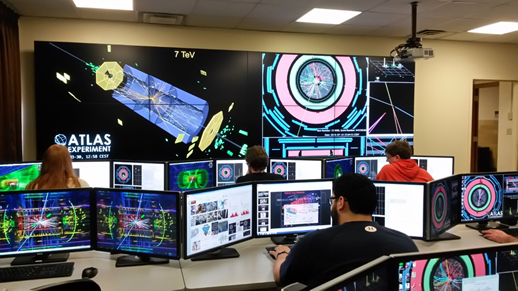
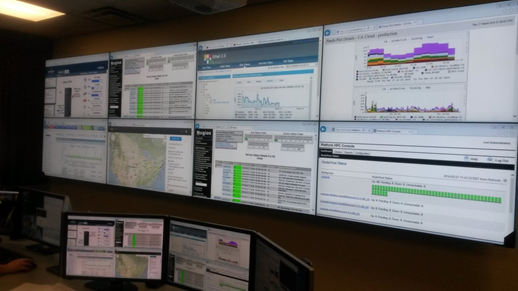
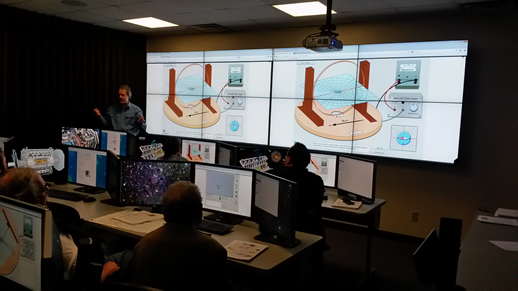
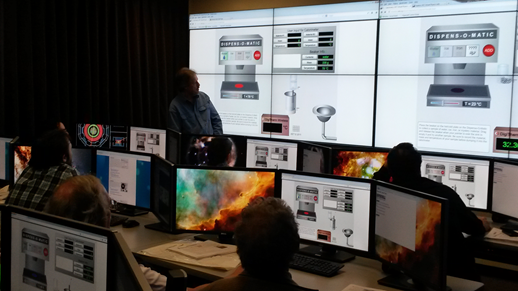
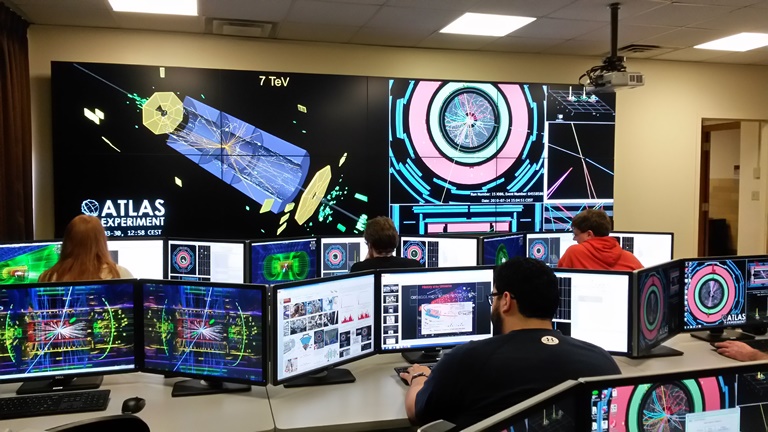
The 16 Mega-pixel Hiperwall visualization system
consists of a 16 feet wide by 4.6 feet high tiled display wall connected
to nine high-end Tier4 Data Analysis workstations connected to triple
monitors, each equipped with dual-NVIDIA multi-core graphics cards that
provide parallel processing capabilities needed to visualize very large
datasets efficiently.Each
of the nine Tier4 workstations has a dual-boot Operating System (Windows
7 and Scientific Linux 6.4) mechanism.The Hiperwall software runs as an application
operating on a standard PCs connected via a 1 Gbps network switch.
Hiperwall’s tiled grid-based display system software architecture
applies parallel processing techniques to overcome the performance
limitations typically associated with the display of large multiple
images on multiple display devices (flat-panel tiles) simultaneously, at
once. Users can display a single image across the entire display area,
but can also display many different images simultaneously on the display
area.
The key feature of the display wall is the bezel size
of the display-tiles.
Arranged in a 4x2 array, each tile is a high-end commercial-brand 55”
Samsung backlit-LED HDTV that has a very narrow bezel size of about 0.1
inches (one-tenth of an inch). Each of the Hiperwall display node PCs is responsible for
displaying and rendering a portion of the overall image that is being
displayed on the display wall. Thus, all the Hiperwall PCs work in
parallel to render the full image.One of the nice features about this display wall is that students
also have the ability to
control the Hiperwall visualization system remotely from distant
locations via a tablet.The display-node computers that drive the Hiperwall system work in
parallel, giving flexibility and scalability, while allowing users to
place contents on one or multiple display tiles all at once with a very
high resolution.Users have
the ability to display a single image (up to 1 GB in size) across the
entire display or they can display many different images simultaneously.Each image can be independently sized (zoomed), positioned, and
rotated. For video, animations and for streaming movies across the
network,the Hiperwall visualization system has powerfulstreamer software
that can provide up to 60 frames per second (FPS) feeds to the display
wall.
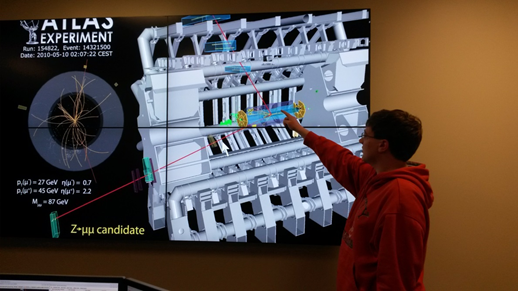
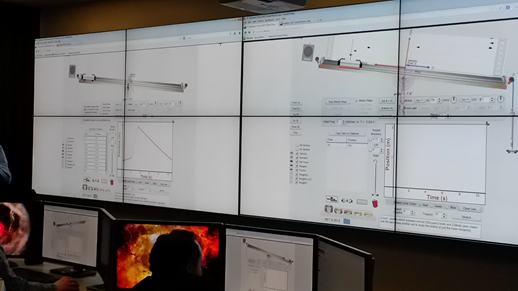
The Hiperwall
system allows the user to display a wide variety of high-resolution 2D
and 3D images, event animations, and time-varying data in real time all
at once on multiple display tiles, according to the needs of the users. Hiperwall technology
allows a collaborative visualization platform that can visualize
enormous data sets and allows researchers/users to see the details,
while retaining the context of the surrounding data. This allows us to
collaborate and share detailed information and the data events. For our
data analysis and visualization tasks we are currently using the CERN’s
Atlantis, Hypatia and the Minerva 2D-visualization packages and the
Camelia 3D-visualization package. For the 3D visualization tasks
we are using CERN’s new windows-based
Camelia 3D-visualization software package that includes event animation
features.Hiperwall visualization system is also connected to our OSG
(Open Science Grid) Tier3 Cluster via the 9 high-end Tier4 Data Analysis
workstations so that we can look at the data events in real-time as they
are being processed.We are also using the Hiperwall visualization display system as a
Tier3 Grid Command Center for Bellarmine University’s Tier3 OSG
Supercomputer.
The Hiperwall system has created a state-of-the-art and a
dynamic/interactive
visualization environment by engaging our students
in inquiry-based visual learning, and for conducting interactive and
exploratory data analyses activities.
