Measures of Student Achievement
Bellarmine University identifies, evaluates, and publishes goals and outcomes for student
achievement appropriate to our mission, the nature of the students we serve, and the kinds of programs offered. Bellarmine University uses multiple measures to document student success.
Tracking and monitoring multiple student measures ensures that our graduating students are prepared for meaningful lives, rewarding careers, ethical leadership, and service to improve the human condition.
The faculty, staff and administration of Bellarmine University, along with its Board of Trustees, rely on many measures to monitor strategic goals and ensure continuous improvement, including the following:
First Year, Full-time retention
Retention is an important measure of student achievement and persistence. In particular, an institution's second-year retention rate (i.e., the percentage of first-time, full-time students who return for sophomore year) has emerged as an industry standard
throughout higher education.
Bellarmine University has met or surpassed it’s established minimum retention rate of 78% seven times in the last 10 years and has met or surpassed it’s goal retention rate of 82% once in the last 10 years.
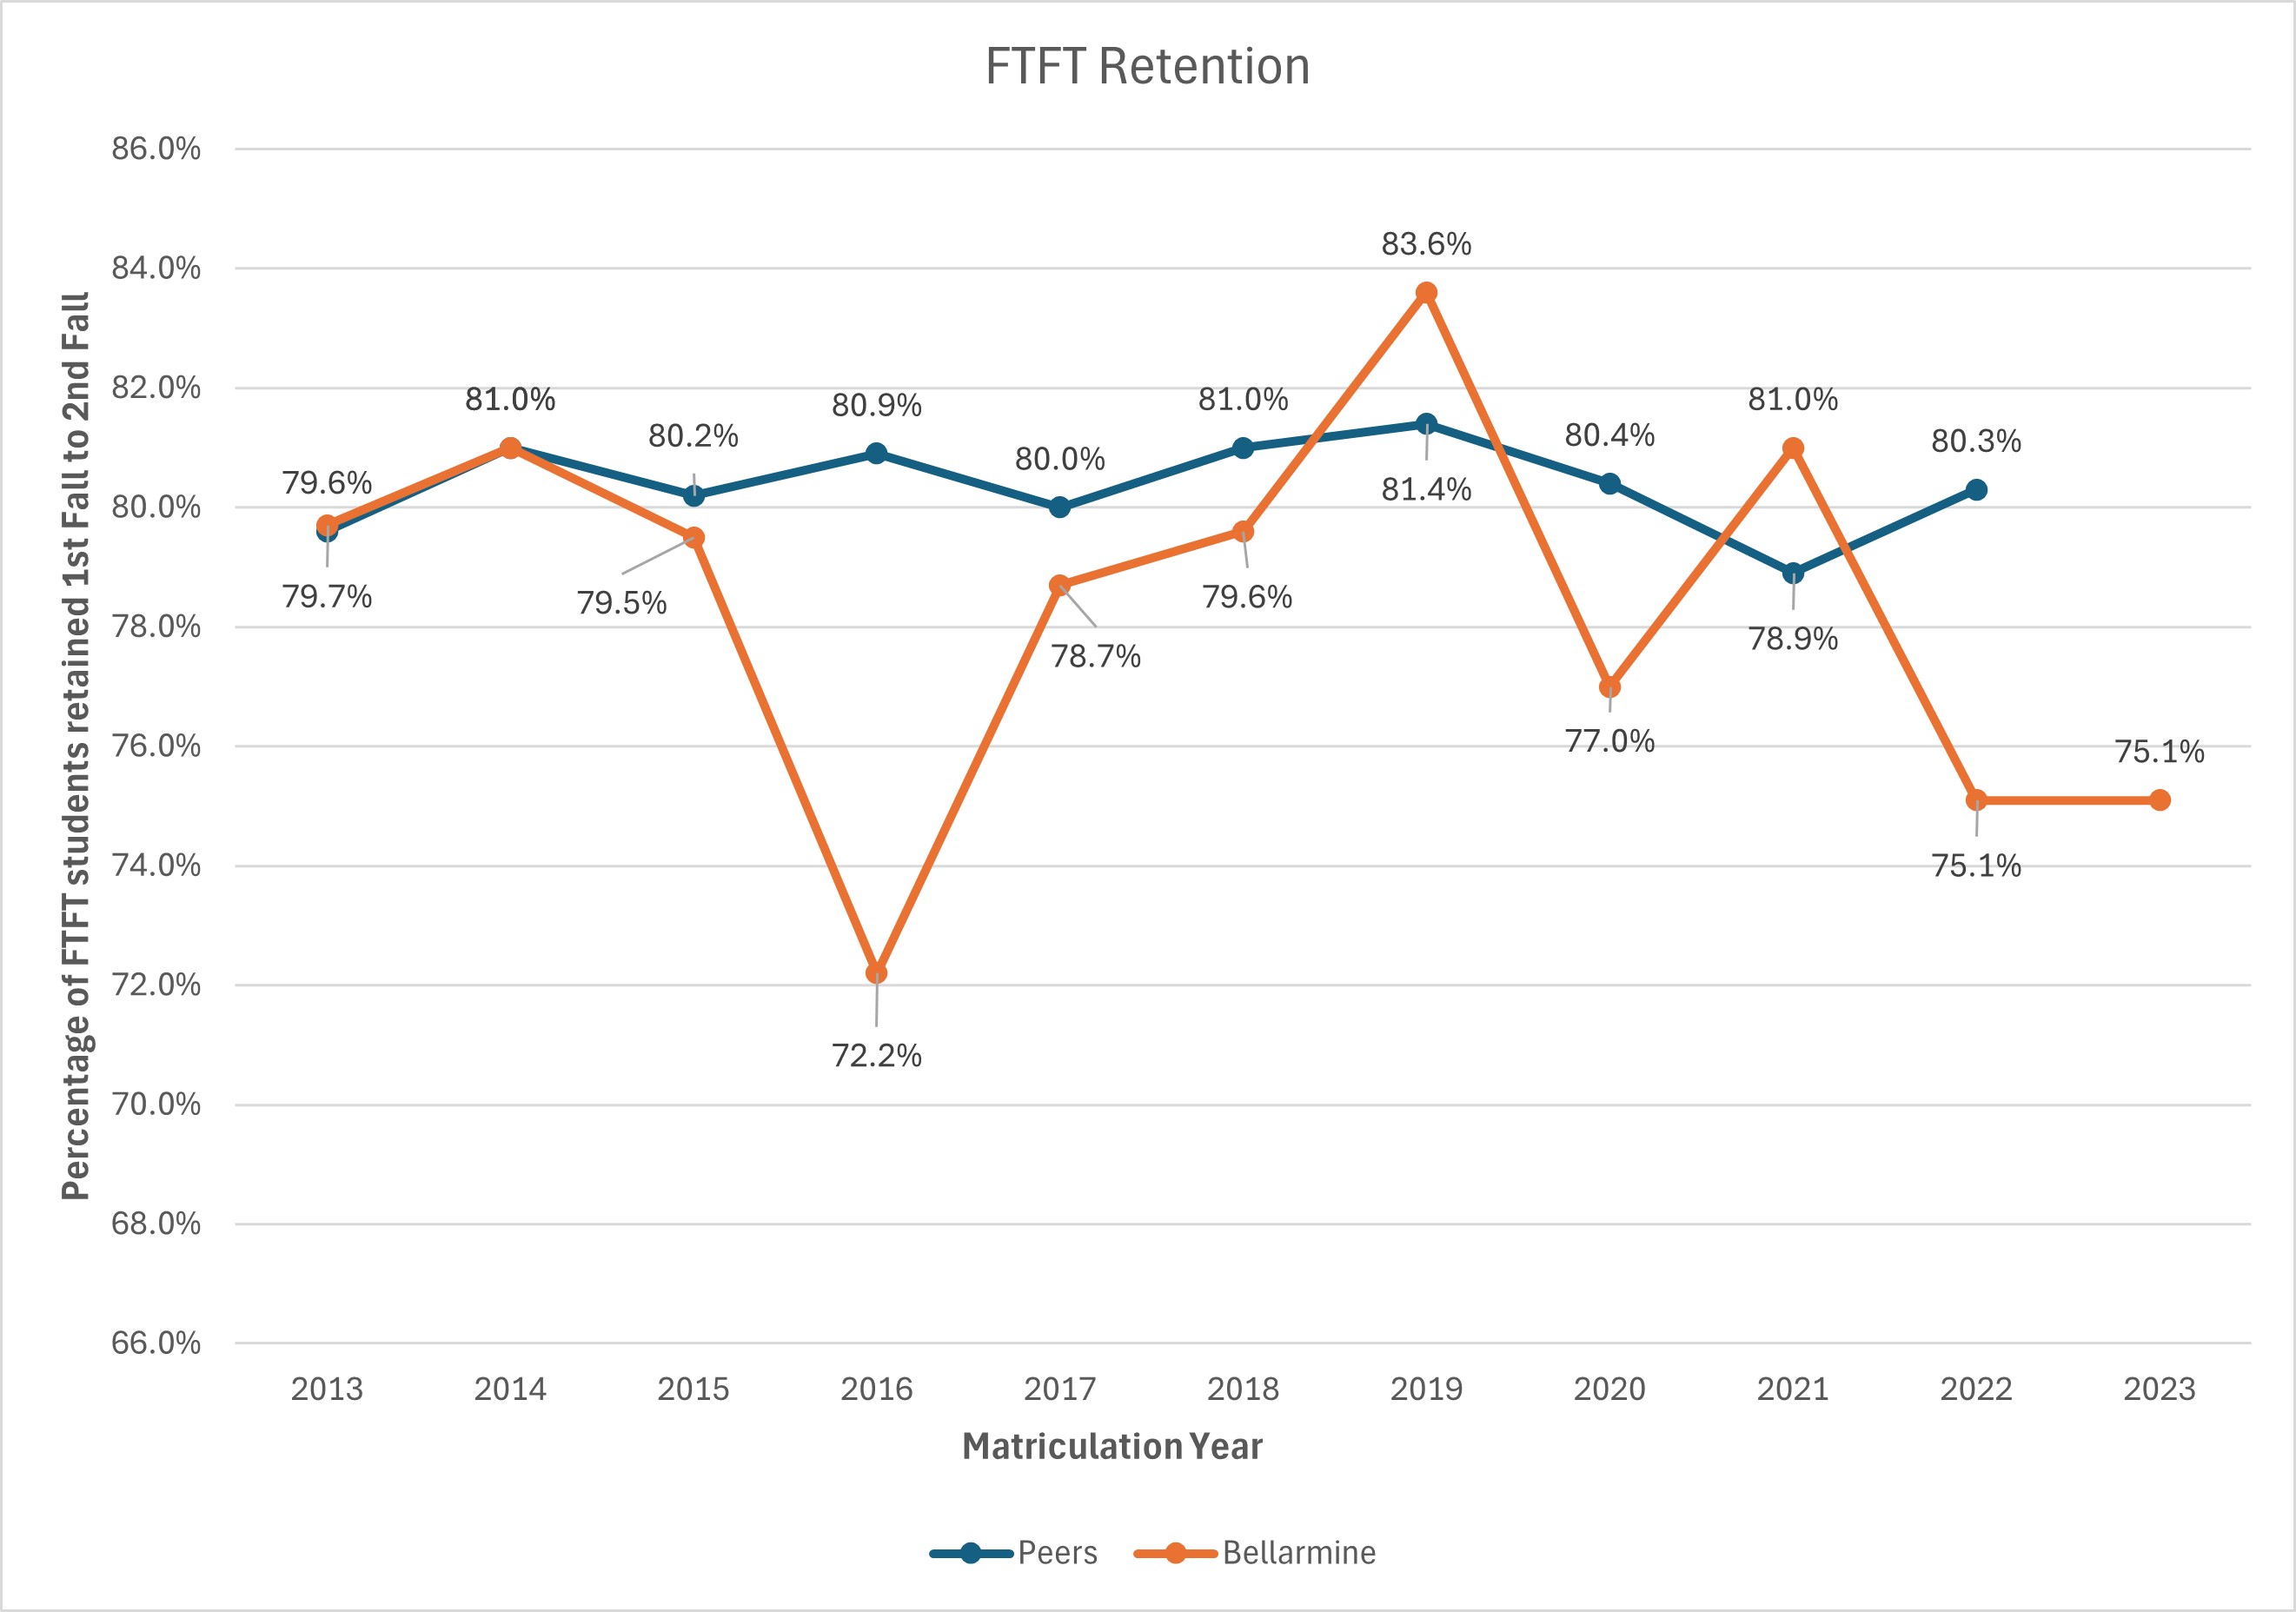
*Peer data for the most recent academic year is not available due to IPEDS data release schedules.
Source: IPEDS, Bellarmine University, Office of Institutional Research and Effectiveness
6-year Undergraduate graduation rate
6-year graduation rates for first-time, full-time undergraduate students who enter in the fall semester are another important measure of student achievement and persistence. The University relies upon graduation rates as one of the key indicators
of achievement among the undergraduate student population.
Bellarmine has met or surpassed their established minimum graduation rate of 64% nine times out of the last 10 years and has nearly met their goal graduation rate each year. Bellarmine places a heavy emphasis on its student success initiatives
beginning during the first year and continuing through sophomore, junior and senior year and has also developed additional programming to advise students who fall behind in order to help them achieve their degree in by their sixth year.
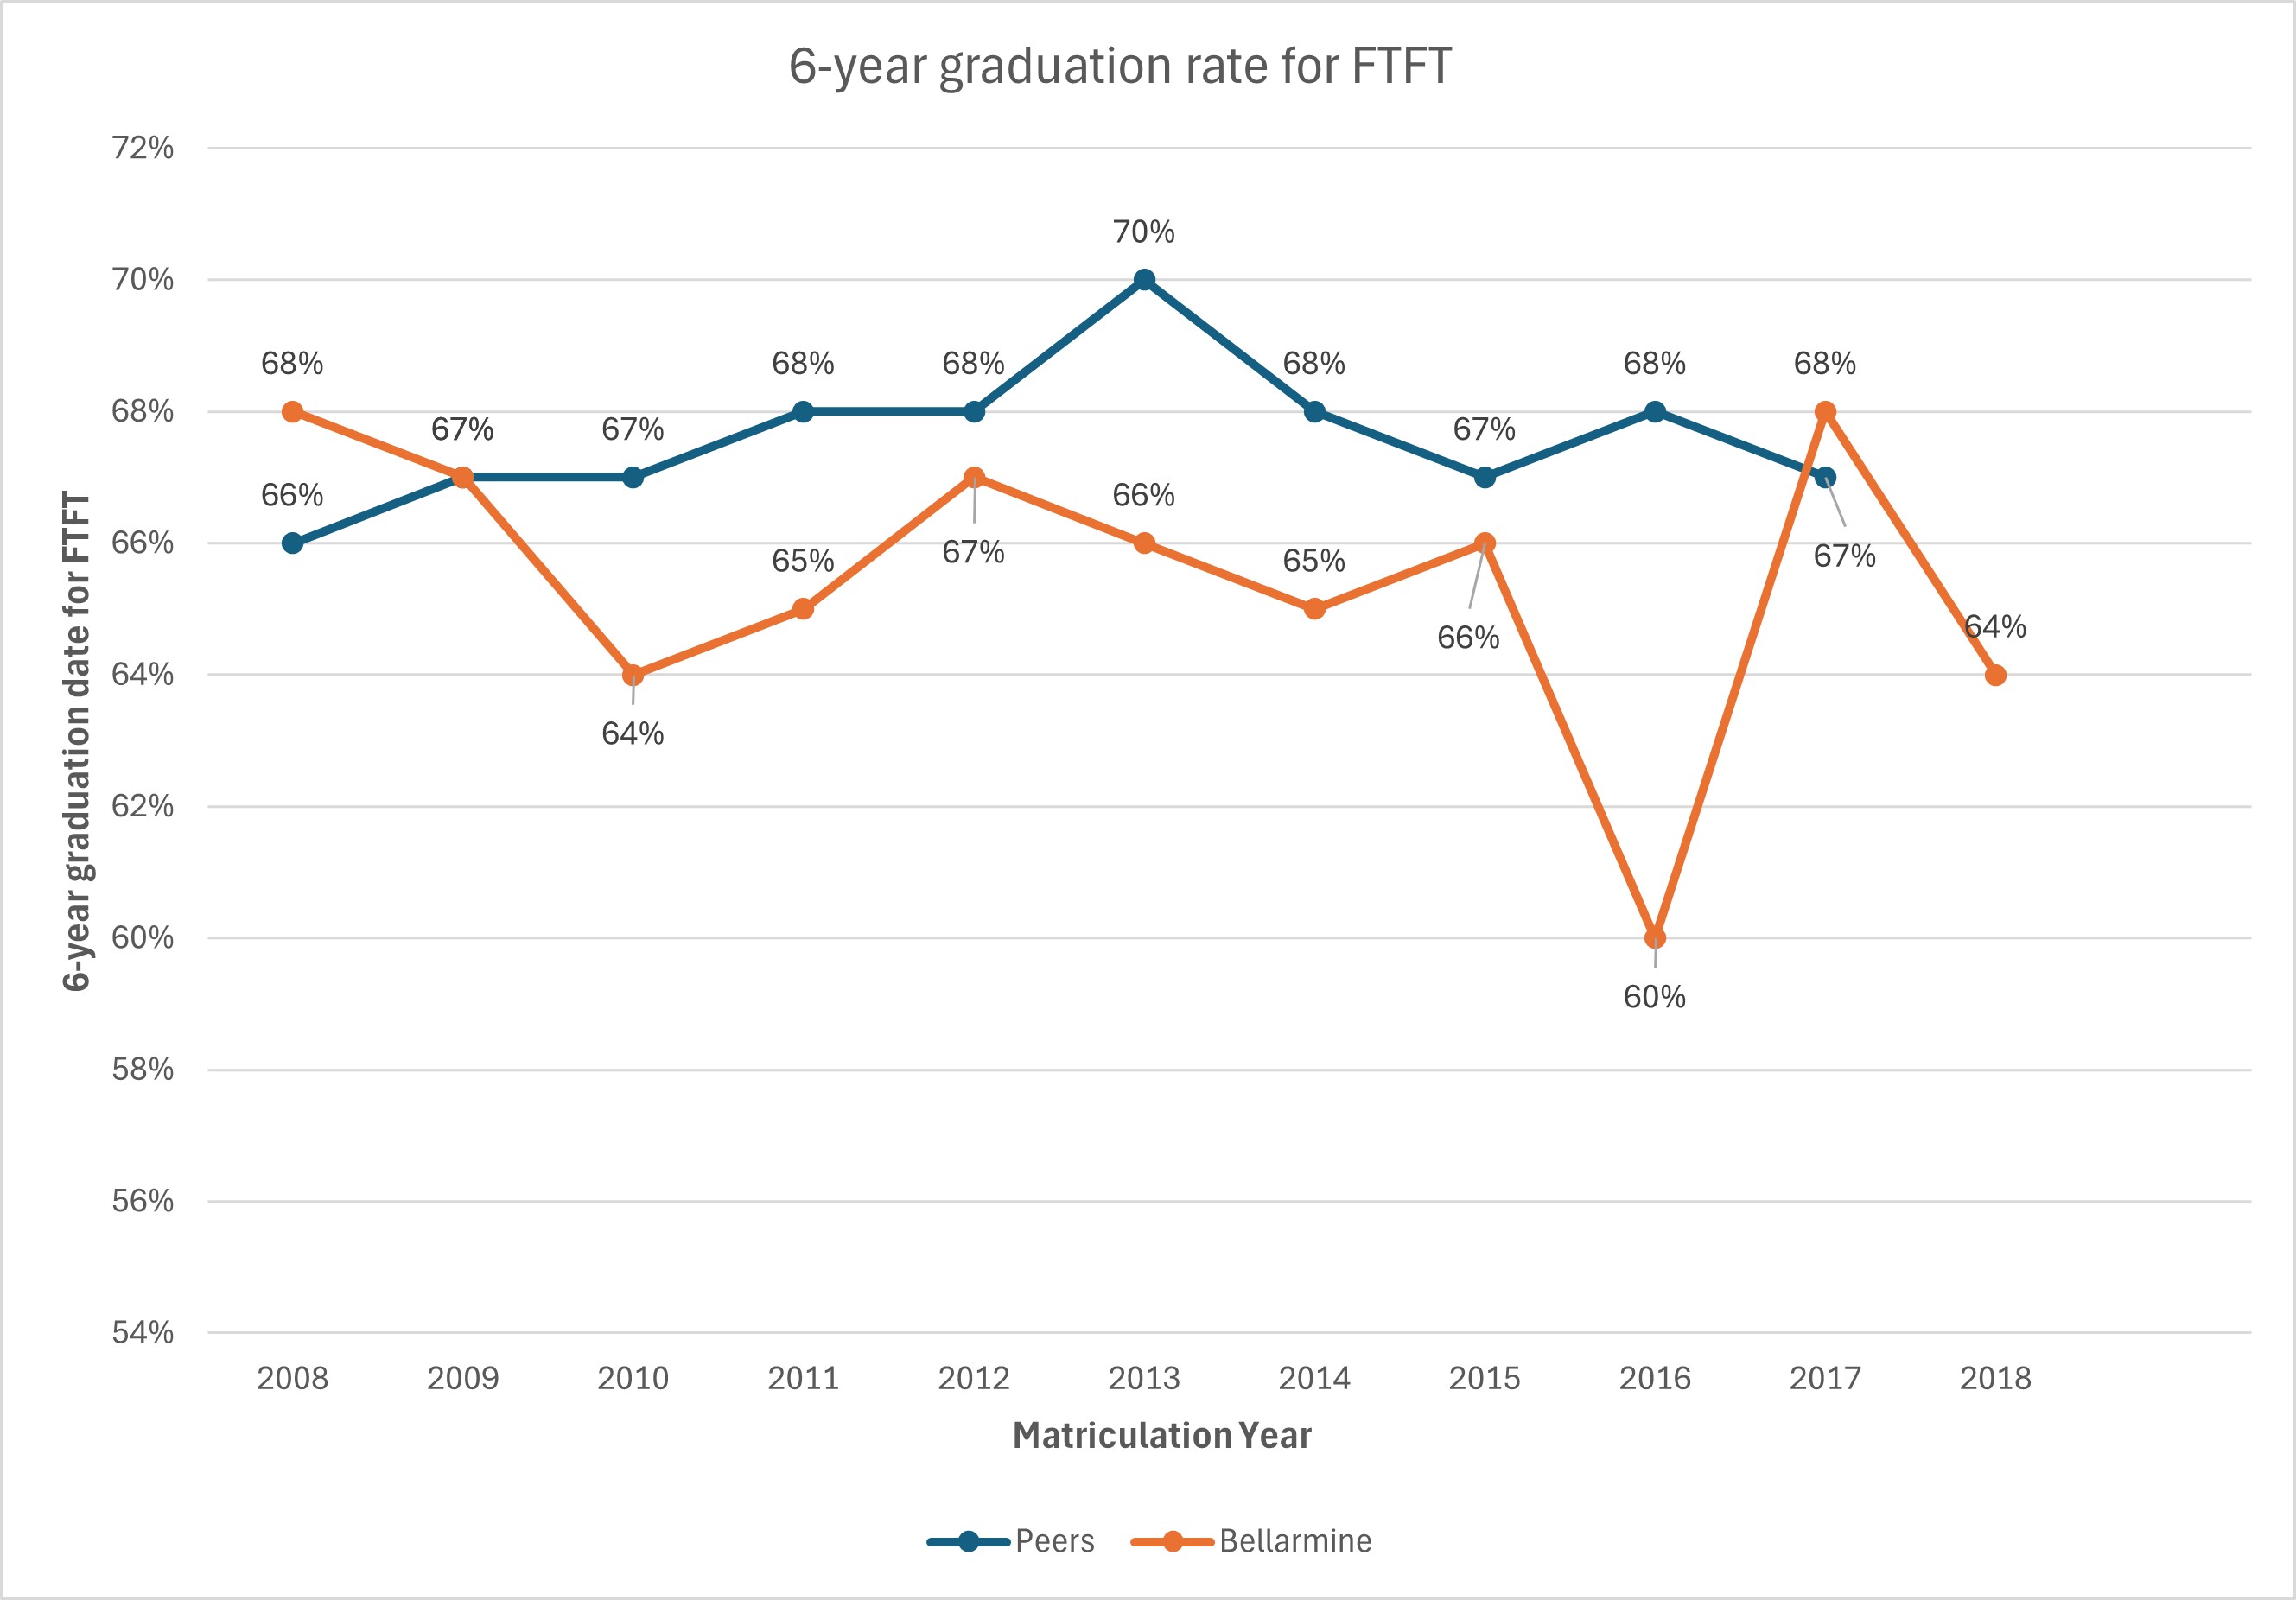
*Peer data for the most recent academic year is not available due to IPEDS data release schedules.
Source: IPEDS, Bellarmine University, Office of Institutional Research and Effectiveness
Career Outcomes
Bellarmine University tracks and analyzes the rate of graduates who are working, continuing their education or serving in the military on a regular basis. Bellarmine connects these outcomes back to the strategic design of both curricular and noncurricular
academic program objectives, as well as the performance of the University's many student success initiatives, ancillary academic resources and student service offices.
Bellarmine has met or surpassed their established minimum rate of 10% above the national average seven times in the past seven years and met or surpassed their goal rate of 15% above the national average five times in the last seven years.
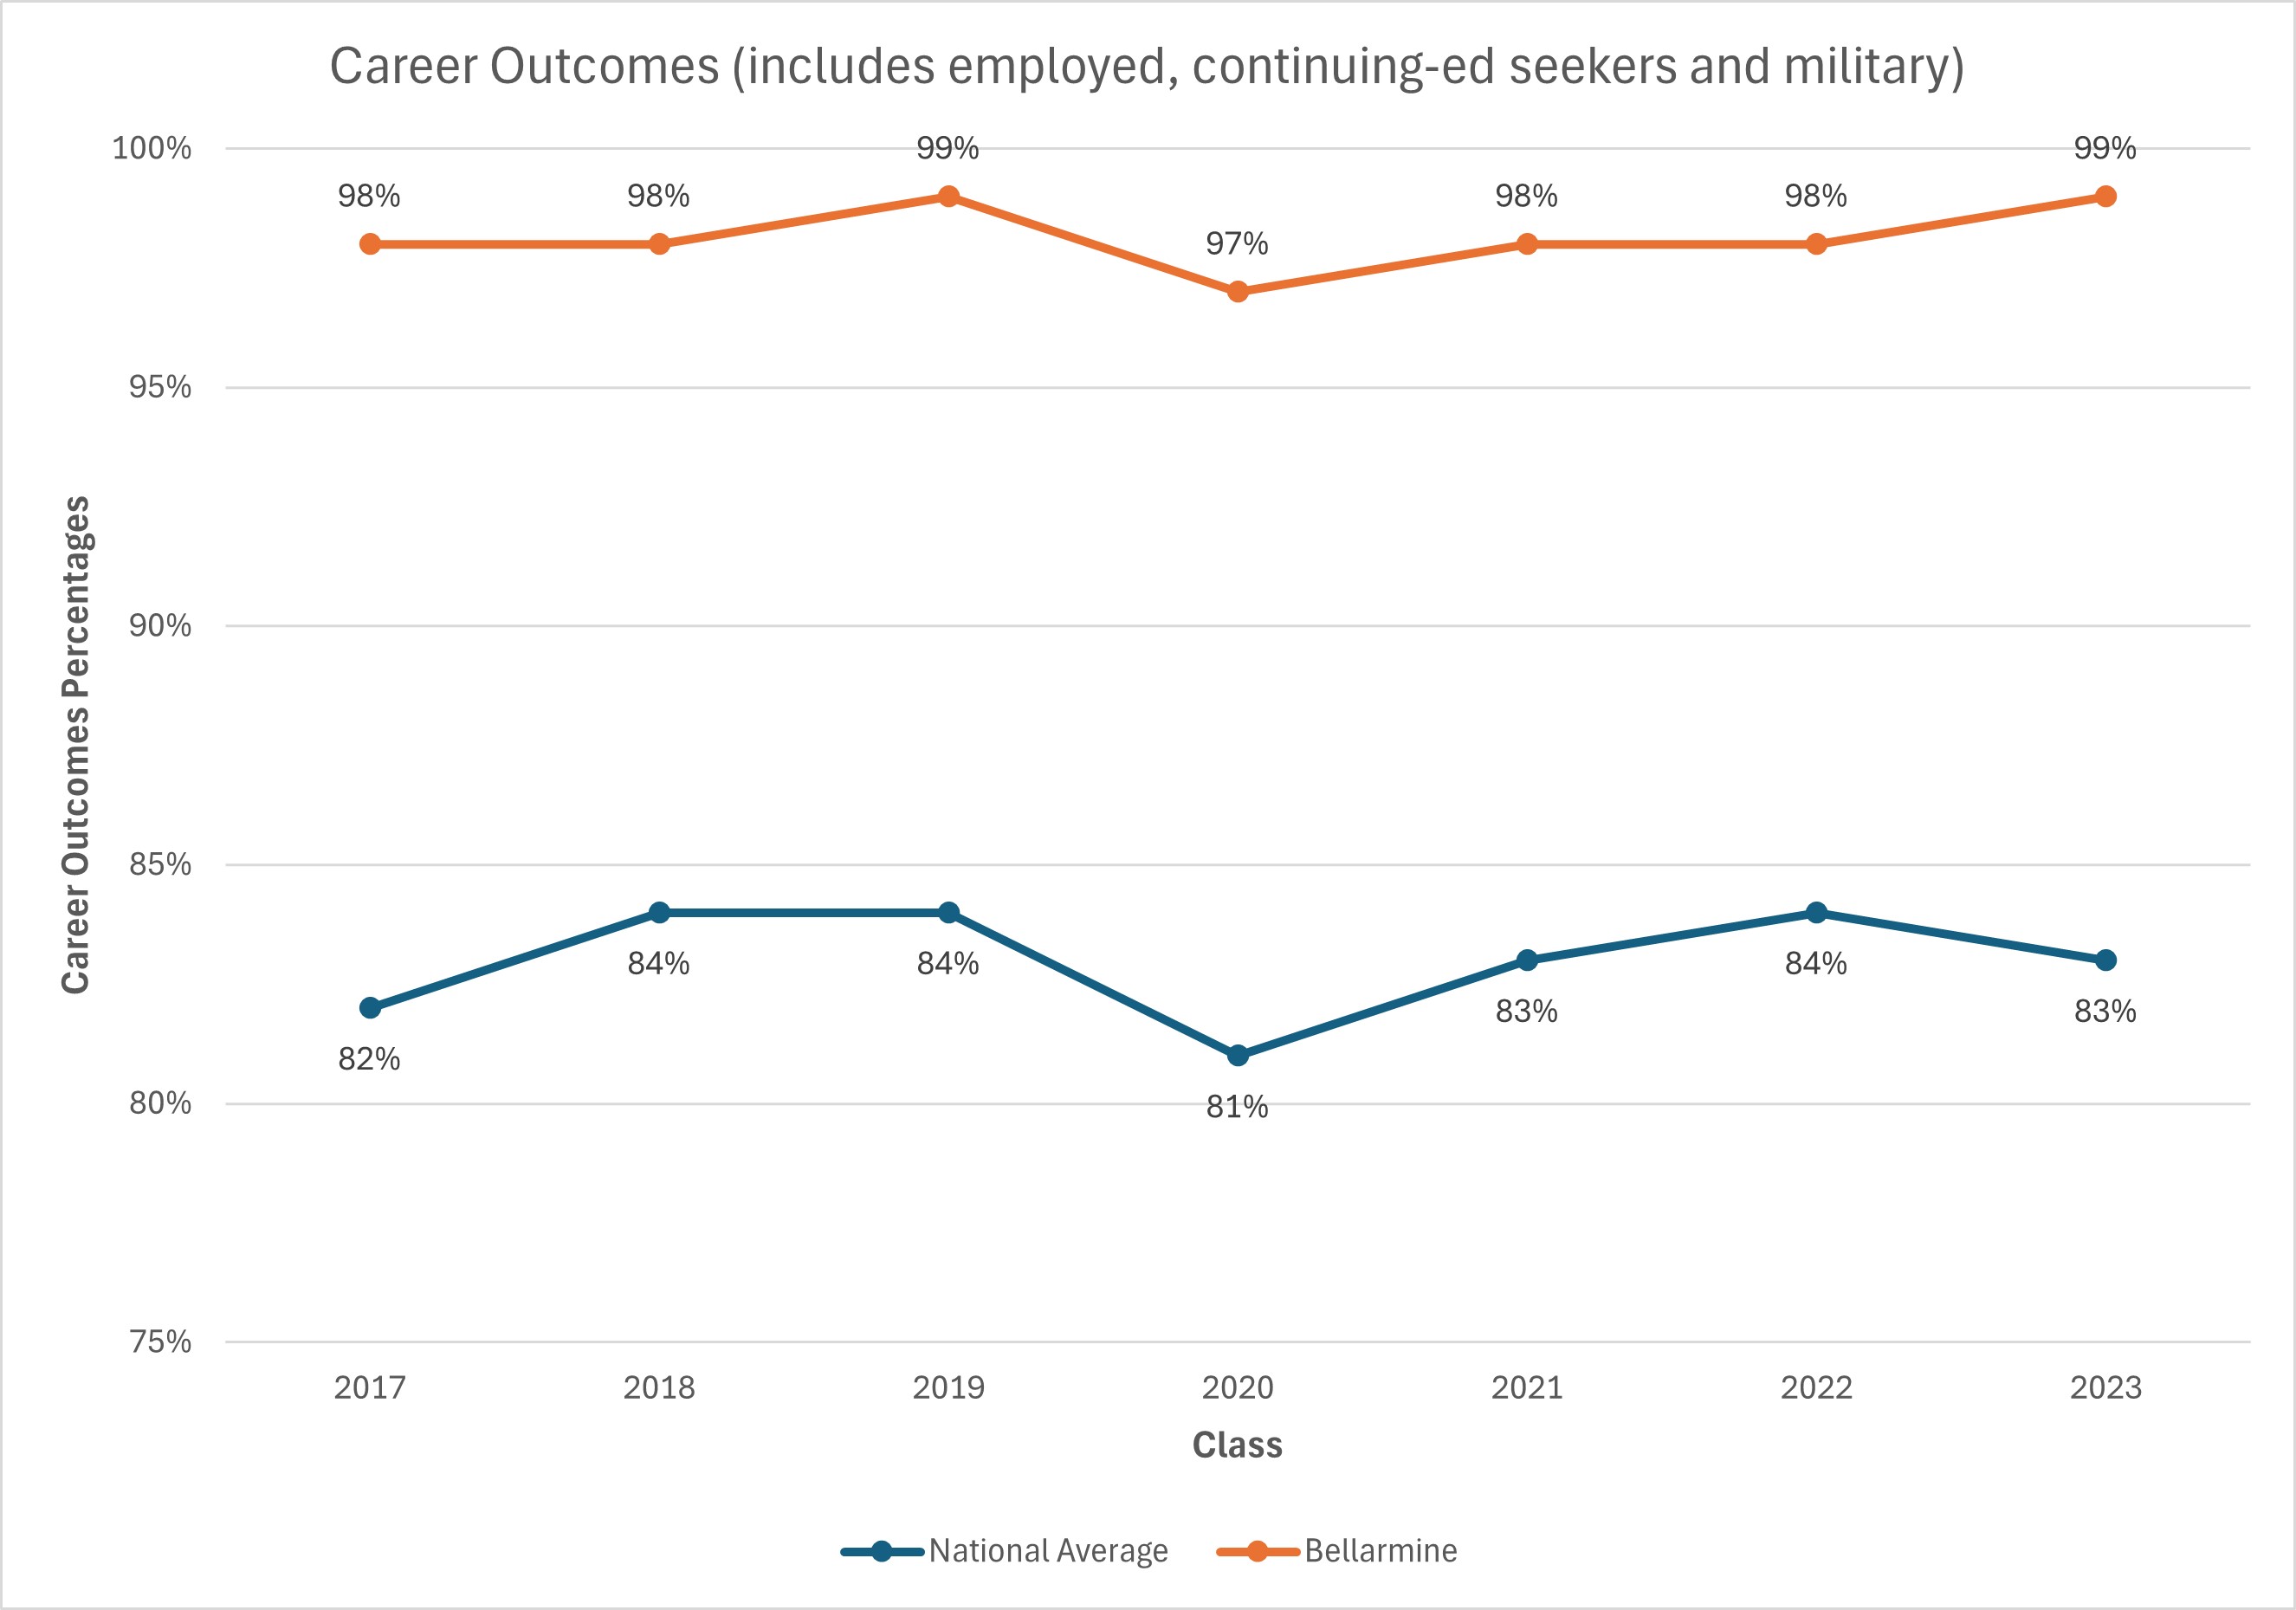
Source: NACE, Bellarmine University, Career Services Center